Installation
Learning Objectives:
-
What is R? What is RStudio?
-
Install R an RStudio
-
Familiarize with RStudio interface
What is R and RStudio?
R is a high-level computer language that is designed for statistics and graphics. One main feature is vector program language like Matlab. It is initially written by Ross Ihaka and Robert Gentleman (hence the name of the software). Currently, it is a free open source software maintained by several contributors.
Compared to alternatives, SAS, Matlab or Stata, R is completely free. Another benefit is that it is open source. This means that there is no black box for everything you use. You know what you are doing. It is also freely expendable so that you can do what you want to do.
RStudio is an integrated development editor (IDE) for R. It is easier to write code using the editor.
Download
We first cover how to download R and RStudio. Then we will study the basic interface for RStudio.
Download R
Head to http://cran.r-project.org/ to download R. On the top of the page, you should see this. Choose the option based on your operating system.

For example, if you choose the option for Windows, you will then see this. Click on the option install R for the first time.
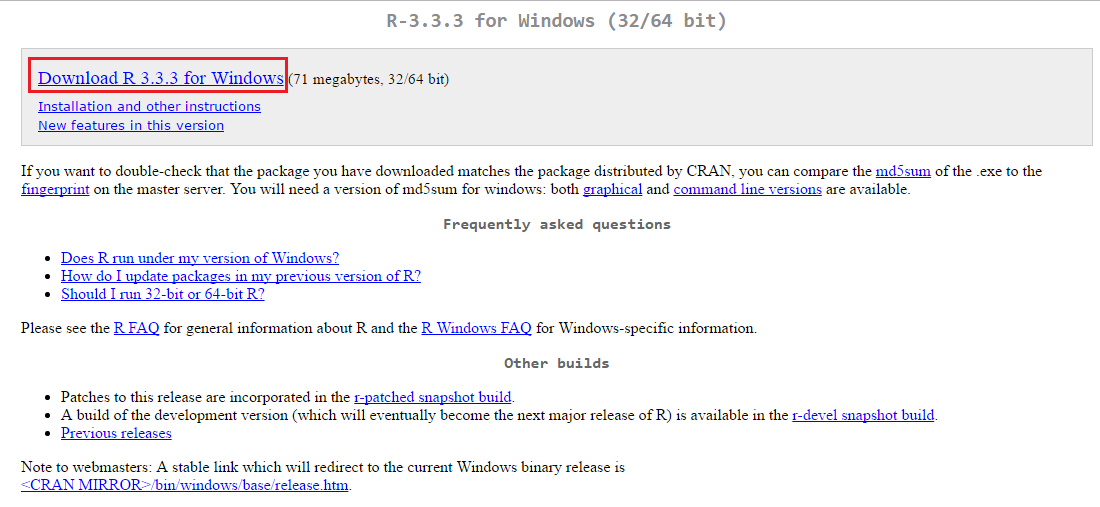
You will then reach this page. Click on the link to download R version 3.3.3. The download should then start.

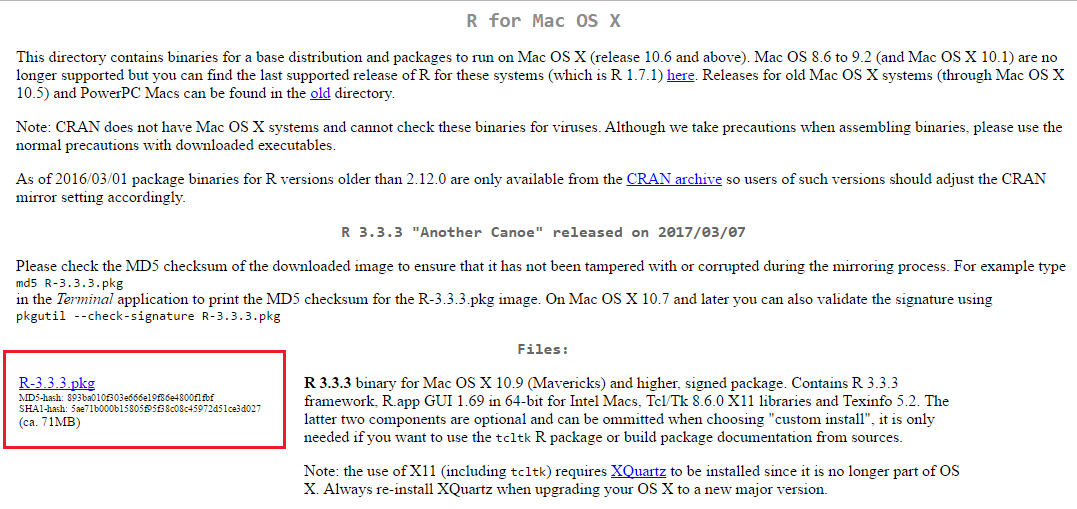
For Mac OS, clicking on the option for Mac brings you to this page. Click on the link in the red box to download R for Mac. The download should start when you click the link.
Using RStduio
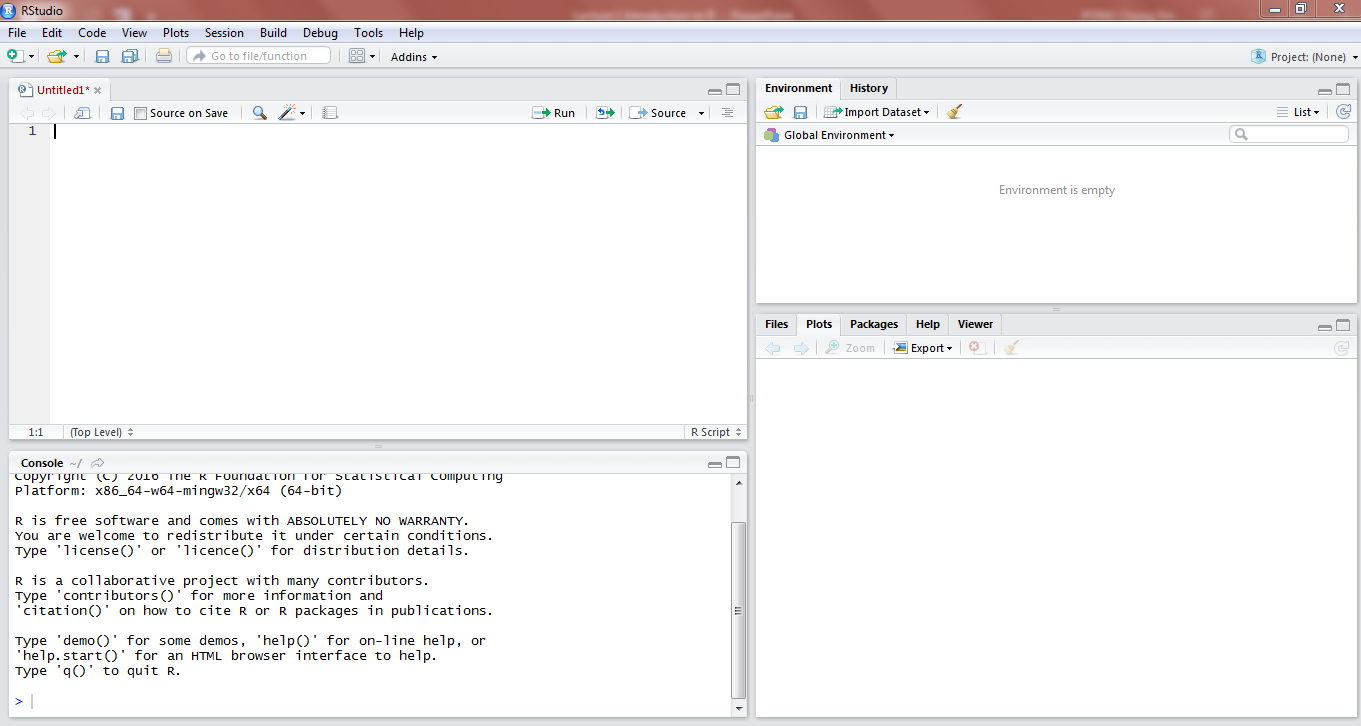
Opening RStudio, you should see something as in Figure 5.
As in Figure 6, there are 2 places where you can enter your code, as highlighted in red.
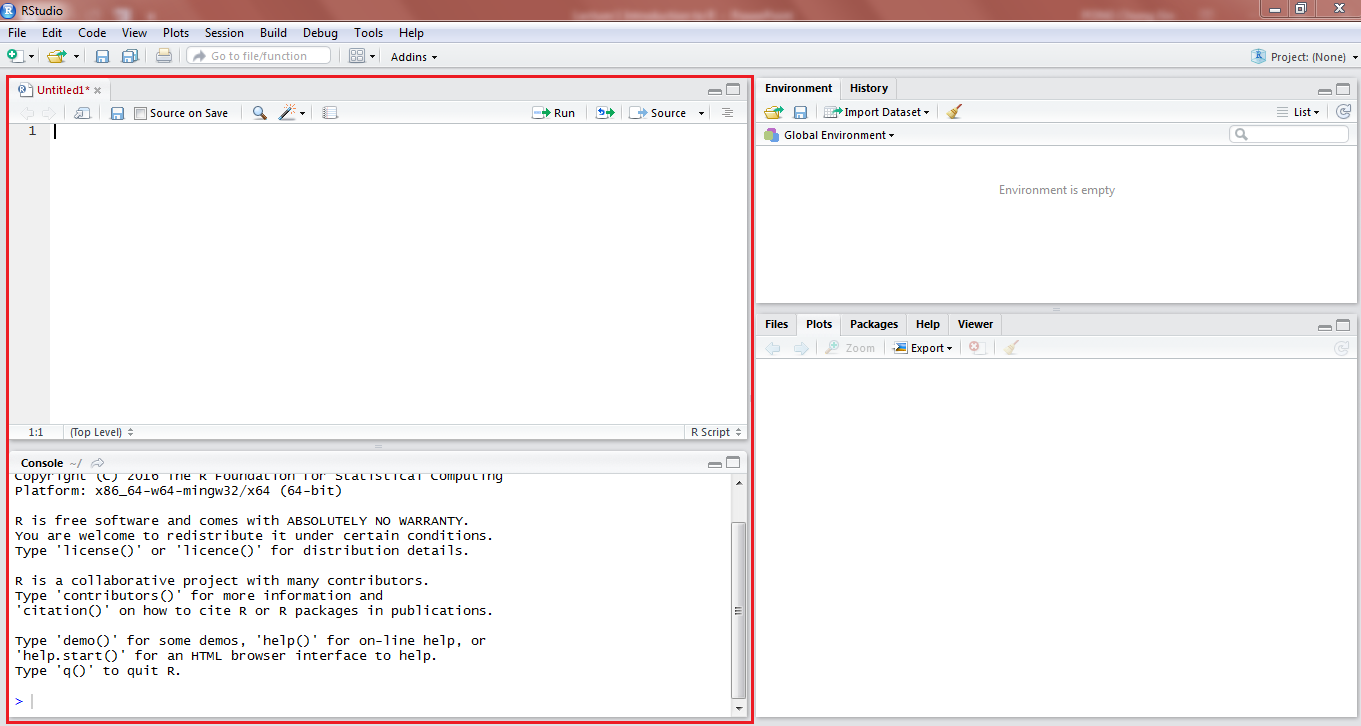
The top part is called the code editor, where you can type your code, and choose to run it after you finish typing all of it.
You can also type your code in the console, which is below the code editor.
In the console, seeing the > symbol means that you are writing a new line of code. You can use the console for calculations, but for coding it is recommended you use the code editor if you wish to edit or reuse the code in future.
As in Figure 7, on the top right hand side, you will see a window called Global Environment. This is where all your data(downloaded data, assigned vectors etc) will be shown. Clicking on a data name in this part will open up the data.
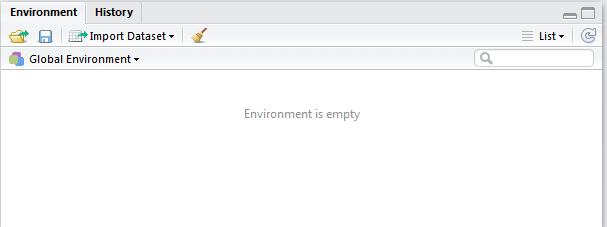
You can also view your history of past commands in the History tab.
As in Figure 8, at the bottom right hand side, you see this window which shows you the files, viewer, packages, and also the help window.
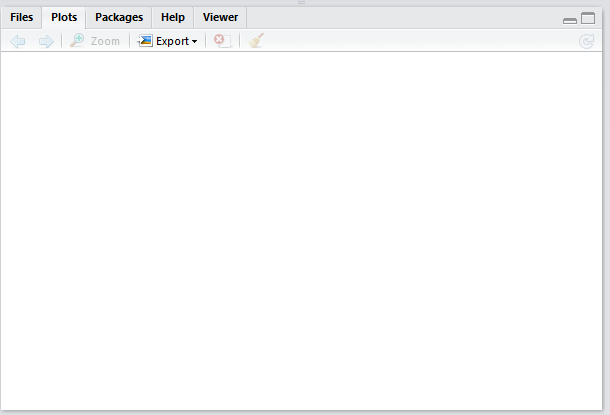
For this course, we will mainly be using this to view plots/graphs, which will be displayed here when you run the code to generate the graphs.