Candle Stick
I have developed the following R package to determine candle stick patterns. You can check out more at GitHub.
CandleStickPattern
This package finds common candle stick patterns using daily data (OHLC data).
Overview
The current version package covers the following patterns:
- Doji family (1-day pattern)
- Doji
doji() - Dragonfly Doji
dragonfly.doji() - Gravestone Doji
gravestone.doji()
- Doji
- Hammer family (2-day pattern)
- Hammer/Hangman
hammer() - Inverted Hammer/Shooting Star
inverted.hammer
- Hammer/Hangman
- Engulfing family (2-day pattern)
- Bullish Engulfing
bullish.engulf() - Bearish Engulfing
bearish.engulf()
- Bullish Engulfing
- Harami family (2-day pattern)
- Bullish Harami
bullish.engulf() - Bearish Harami
bearish.harami()
- Bullish Harami
- Reversal family (2-day pattern)
- Piercing line
piercing.line() - Dark cloud Cover
dark.cloud.cover()
- Piercing line
- Kicking family (2-day pattern)
- Kick up
kick.up() - Kick down
kick.down()
- Kick up
- Three-in-a-row (3-day pattern)
- Three white soldiers
three.white.soliders() - Three Black crows
three.black.crows()
- Three white soldiers
- Star (3-day pattern)
- Morning star
morning.star() - Evening star
evening.star()
- Morning star
- Three Method (5-day pattern)
- Rising three
rising.three() - Falling three
falling.three()
- Rising three
Moreover, it captures trends using exponential moving average (EMA):
- EMA trends
- up trend
up.trend() - down trend
down.trend()
- up trend
Installation
To install this package, it is the easist to install devtools package first:
install.packages("devtools")Now load the package using library()
library(devtools)Then we can use the install_github to get the package directly:
install_github("kochiuyu/CandleStickPattern")Finally, we load the package using library()
library(CandleStickPattern)Usage
You can see the details of how each function works in vignette
The following demonstrates the usage of the function doji() using Microsoft (ticker: MSFT). We use quantmod package to download data:
library(quantmod)
getSymbols("MSFT", from = "2011-07-08" , to = "2011-07-19")
We first plot the candle chart first:
candleChart(MSFT,theme='white')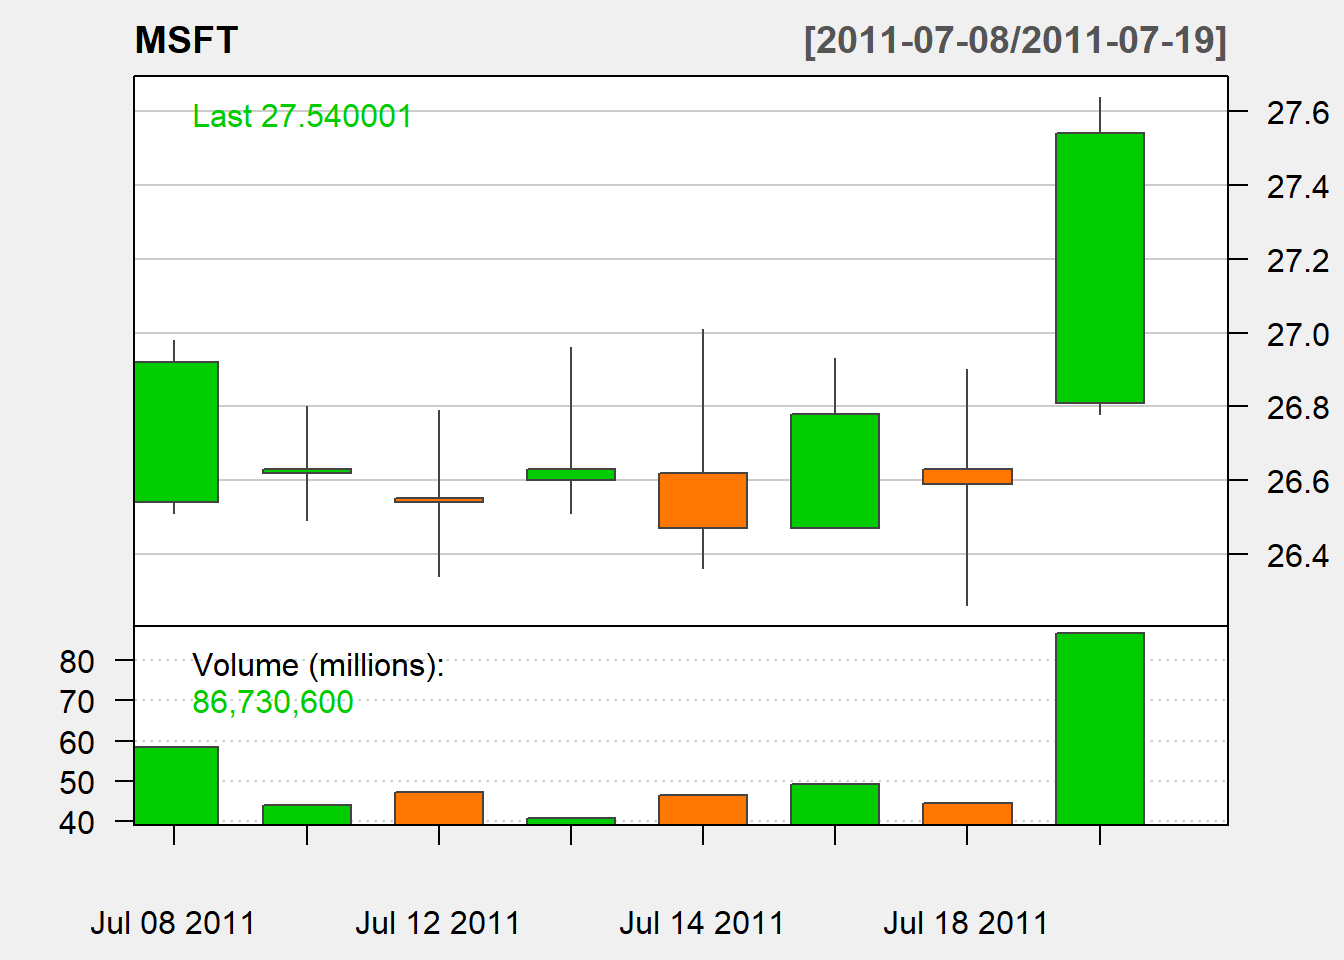
We can see that July 11, 12, 13, and 18 are likely to follow doji pattern. Let us see if we can capture using the function doji:
doji(MSFT)## Warning: timezone of object (UTC) is different than current timezone ().## doji
## 2011-07-08 FALSE
## 2011-07-11 TRUE
## 2011-07-12 TRUE
## 2011-07-13 TRUE
## 2011-07-14 FALSE
## 2011-07-15 FALSE
## 2011-07-18 TRUE
## 2011-07-19 FALSE