Monopoly
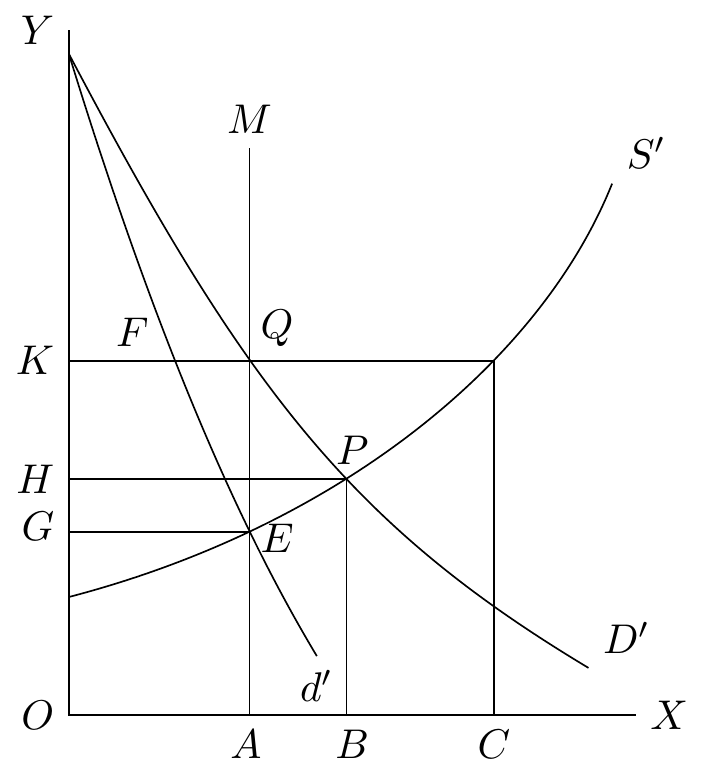
\begin{tikzpicture}[scale=1]
\draw (0,5.8) node [left] {$Y$} --(0,0) node [left] {$O$} --(4.8,0) node [right] {$X$};
\node [below] at (1.5,0) {$A$};
\node [below] at (2.4,0) {$B$};
\node [below] at (3.6,0) {$C$};
\node [left] at (0,2) {$H$};
\node [left] at (0,3) {$K$};
\node [right] at (1.5,1.5) {$E$};
\node [above left] at (0.8,3) {$F$};
\node [above] at (2.4,2) {$P$};
\node [above right] at (1.5,3) {$Q$};
%line M
\draw (1.53,0)--(1.53,4.8) node [above] {$M$} ;
% Line GEA
\draw (0,1.55)--(1.53,1.55)--(1.53,0);
\node [left] at (0,1.6) {$G$};
\draw (0,2)--(2.35,2)--(2.35,0);
\draw (0,3)--(3.6,3)--(3.6,0);
\draw (0,1) ..controls (2.3,1.6) and (4,3) ..(4.6,4.5) node [above right] {$S'$};
\draw (0,5.6) ..controls (0.8,3) and (1.5,1.5) ..(2.1,0.5) node [below] {$d'$};
\draw (0,5.6) ..controls (1.5,2.75) and (2.4,1.6) ..(4.4,0.4) node [above right] {$D'$};
\end{tikzpicture}
Demand and Supply
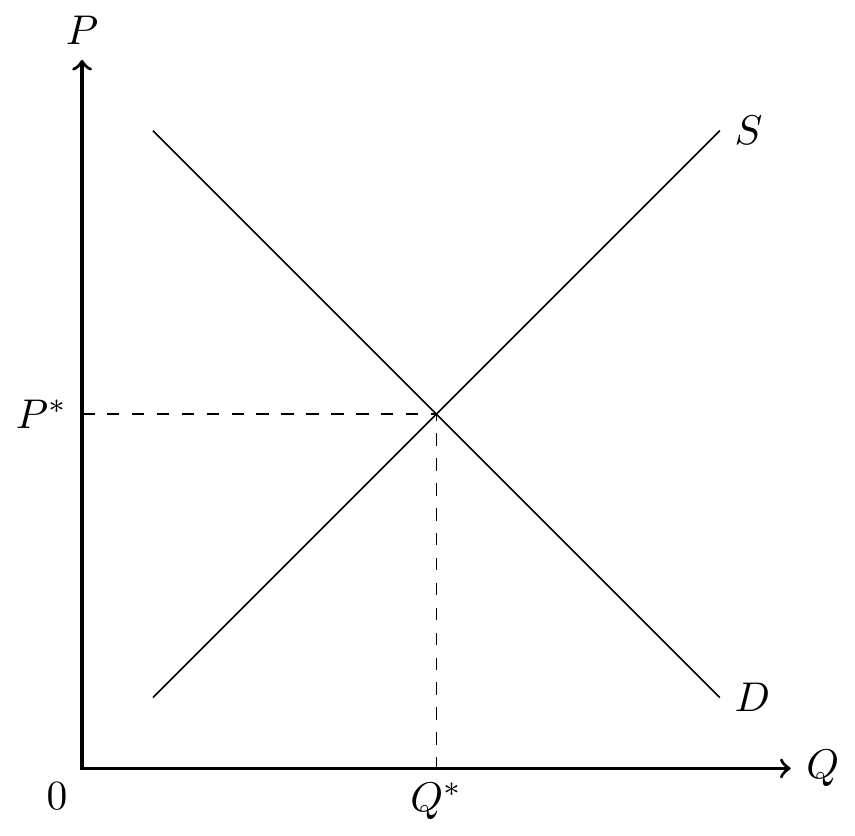
\begin{tikzpicture}[scale=0.6]
\draw[thick,<->] (0,10) node[above]{$P$}--(0,0)--(10,0) node[right]{$Q$};
\node [below left] at (0,0) {$0$};
\node [below] at (5,0) {$Q^*$};
\node [left] at (0,5) {$P^*$};
\draw(1,1)--(9,9) node[right]{$S$};
\draw(1,9)--(9,1) node[right]{$D$};
\draw[dashed](0,5)--(5,5)--(5,0);
\end{tikzpicture}