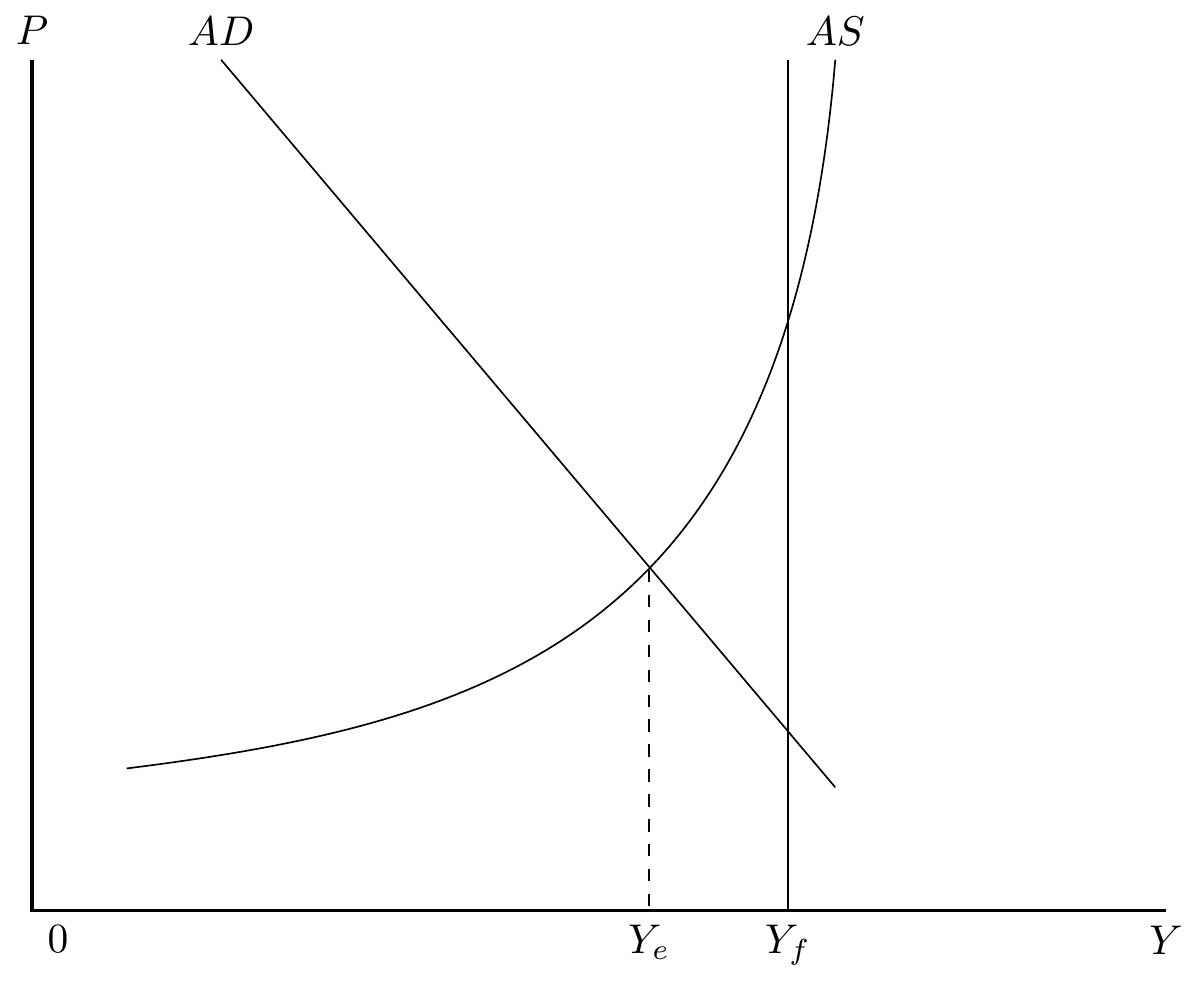
AS-AD
\begin{tikzpicture}[scale=0.8]
\draw[thick] (0,9) node[above]{$P$}--(0,0) node[below right]{$0$}--(12,0) node[below]{$Y$};
\draw(1,1.5) ..controls (5,2) and (8,3) .. (8.5,9) node[above]{$AS$};
\draw (2,9) node[above]{$AD$}--(8.5,1.3);
\draw(8,9)--(8,0) node[below]{$Y_f$};
\draw[dashed](6.53,3.6)--(6.53,0) node[below] {$Y_e$};
\end{tikzpicture}
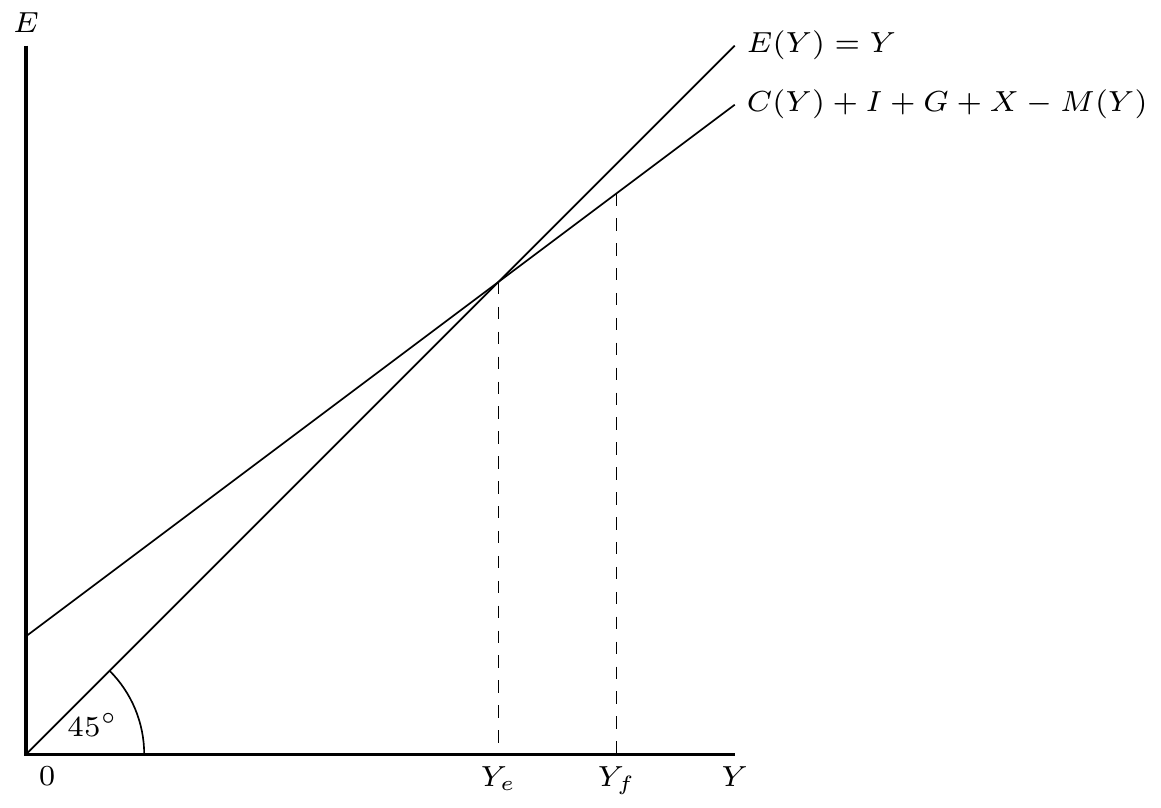
Keyesnian Cross
\begin{tikzpicture}[scale=0.5]
\scriptsize
\draw[thick] (0,12) node[above]{$E$}--(0,0) node[below right]{$0$}--(12,0) node[below]{$Y$};
\draw(0,2)--(12,11) node[right]{$C(Y)+I+G+X-M(Y)$};
\draw(0,0)--(12,12) node[right]{$E(Y)=Y$};
\draw[dashed](8,8)--(8,0) node[below]{$Y_e$};
\draw[dashed](10,9.5)--(10,0) node[below]{$Y_f$};
\draw (0,0) ++(0:2) arc(0:45:2);
\node [right] at (0.5,0.5) {45$^{\circ}$};
\end{tikzpicture}
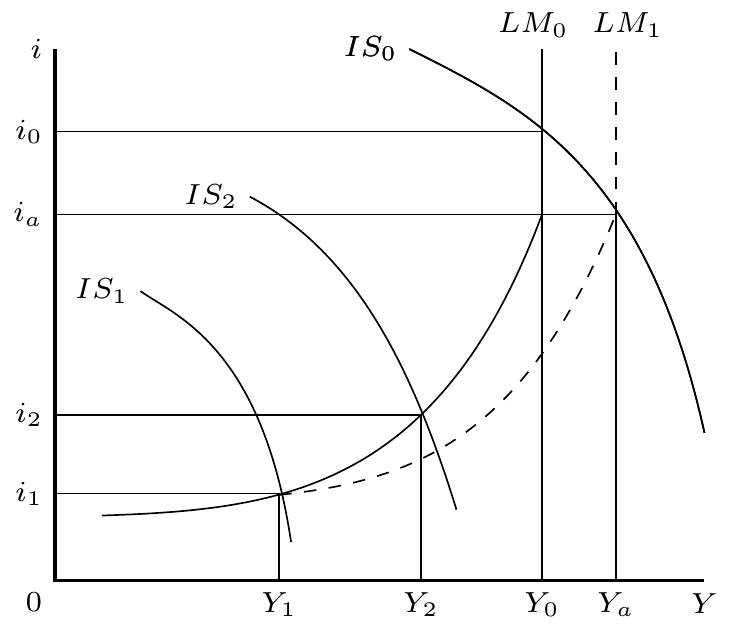
IS-LM
\begin{tikzpicture}[scale=0.5]
\scriptsize
\draw[thick] (0,9) node[left]{$i$}--(0,0) node[below left]{$0$}--(11,0) node[below]{$Y$};
\draw(6,9) node[left]{$IS_0$} ..controls (8,8) and (10,7) .. (11,2.5);
\draw(6,9) node[left]{$IS_0$} ..controls (8,8) and (10,7) .. (11,2.5);
\draw(3.3,6.5) node[left]{$IS_2$} ..controls (5,5.6) and (6,3.8) .. (6.8,1.2);
\draw(1.45,4.9) node[left]{$IS_1$} ..controls (2,4.5) and (3.5,4) .. (4,0.65);
\draw(0.8,1.1) ..controls (3.8,1.2) and (6.5,1.5) .. (8.25,6.2);
\draw[dashed](3.8,1.45) ..controls (6.2,1.7) and (8,2.5) .. (9.5,6.2);
\draw(9.5,0) node[below]{$Y_a$}--(9.5,6.2);
\draw[dashed](9.5,6.2)--(9.5,9);
\draw(8.25,0) node[below]{$Y_0$}--(8.25,9);
\node[above] at (8.1,9){$LM_0$};
\node[above] at (9.7,9){$LM_1$};
\draw(0,1.47) node[left]{$i_1$}--(3.8,1.47)--(3.8,0) node[below]{$Y_1$};
\draw(0,2.8) node[left]{$i_2$}--(6.2,2.8)--(6.2,0) node[below]{$Y_2$};
\draw(0,6.2) node[left]{$i_a$}--(9.5,6.2);
\draw(0,7.6) node[left]{$i_0$}--(8.25,7.6);
\end{tikzpicture}
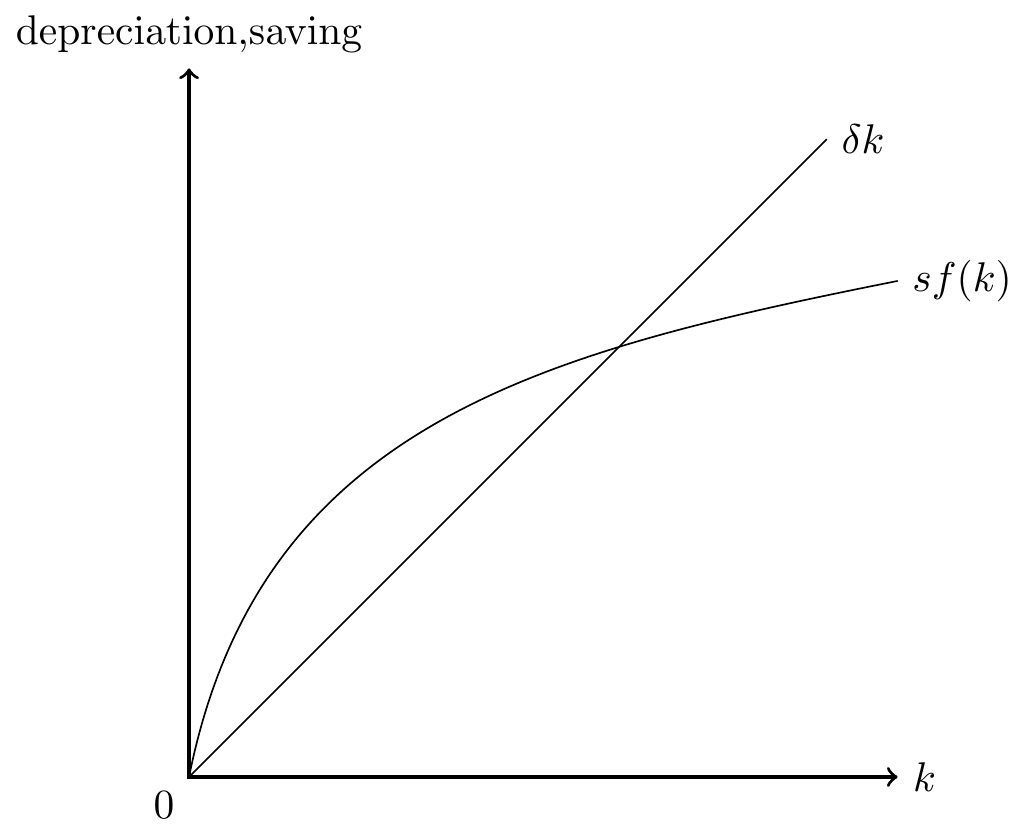
Solow Growth
\begin{tikzpicture}[scale=0.6]
\draw[thick,<->] (0,10) node[above]{depreciation,saving}--(0,0)--(10,0) node[right]{$k$};
\node [below left] at (0,0) {$0$};
\draw(0,0)--(9,9) node[right]{$\delta k$};
\draw(0,0) ..controls (1,5) and (5,6) .. (10,7) node[right]{$sf(k)$};
\end{tikzpicture}
Money Demand
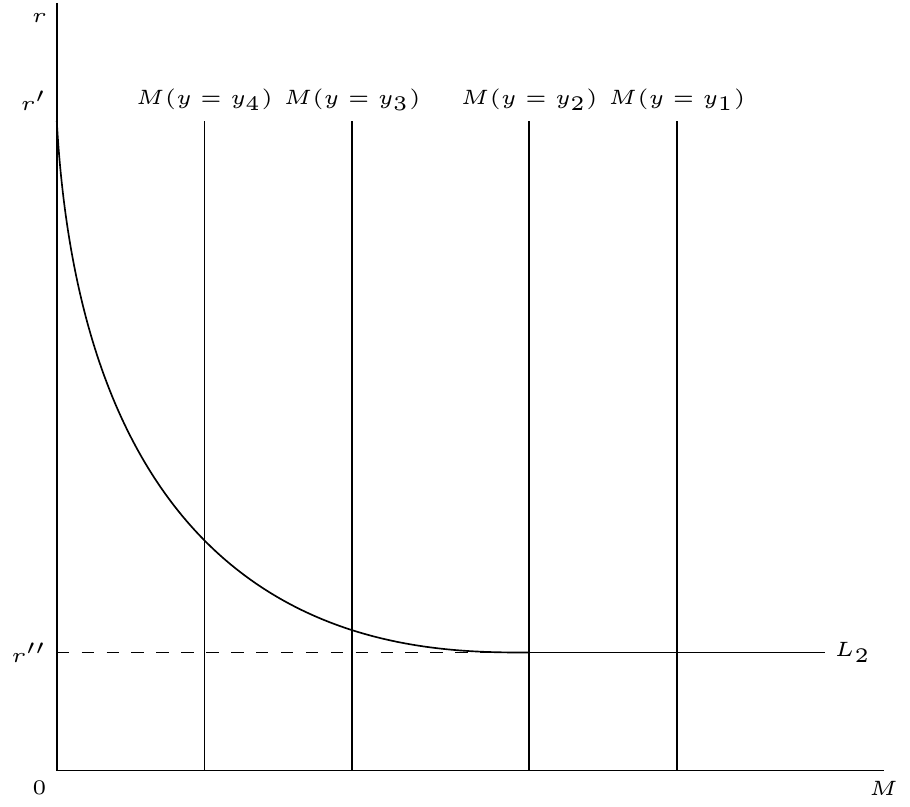
\begin{tikzpicture}[scale=0.5]
\tiny
\draw (0,13) node[below left]{$r$} -- (0,0) node[below left]{$0$} -- (14,0) node[below]{$M$};
\draw(0,11) node[above left]{$r'$} ..controls (0.5,2) and (6,2) .. (8,2);
\draw[dashed](0,2) node[left]{$r''$} -- (8,2);
\draw(8,2) -- (13,2) node[right]{$L_2$} ;
\draw(2.5,11) node[above]{$M(y=y_4)$} -- (2.5,0);
\draw(5,11) node[above]{$M(y=y_3)$} -- (5,0);
\draw(8,11) node[above]{$M(y=y_2)$} -- (8,0);
\draw(10.5,11) node[above]{$M(y=y_1)$} -- (10.5,0);
\end{tikzpicture}
Philips Curves
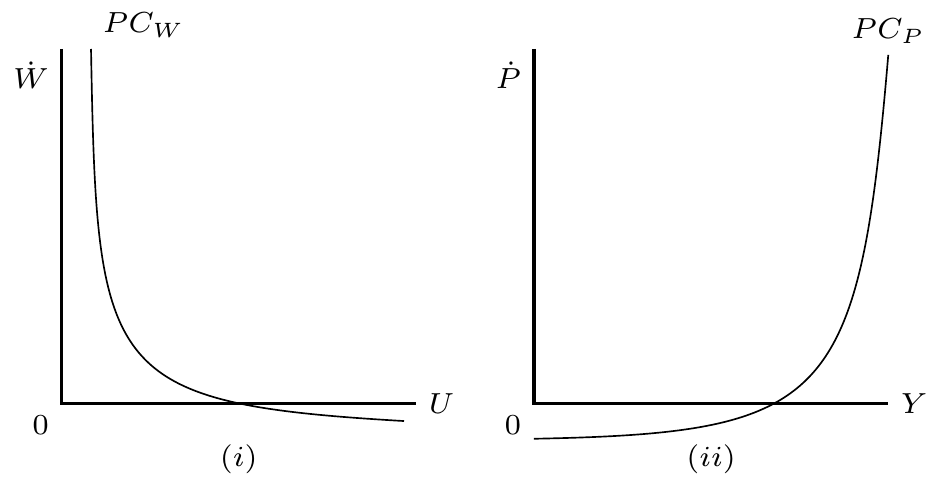
\begin{tikzpicture}[scale=0.5]
\scriptsize
\draw[thick] (0,6) node[below left] {$\dot{W}$} -- (0,0) node[below left]{$0$} -- (6,0) node[right]{$U$};
\node[below] at (3,-0.5) {$(i)$};
\draw(0.5,6) node[above right]{$PC_W$} ..controls (0.6,0.5) and (0.7,0) .. (5.8,-0.3);
\draw[thick][xshift=8cm] (0,6) node[below left] {$\dot{P}$} -- (0,0) node[below left]{$0$} -- (6,0) node[right]{$Y$};
\node[below] at (11,-0.5) {$(ii)$};
\draw[xshift=8cm](0,-0.6) ..controls (5,-0.5) and (5.5,0) .. (6,5.9) node[above]{$PC_P$};
\end{tikzpicture}