Introduction to TikZ
Learning Objectives:
- What is TikZ?
- Basic setup of TikZ
- Demand and Supply Diagram
What is TikZ?
TikZ is the package in LaTeX that allows drawing of nice diagram. See the following exmaple:
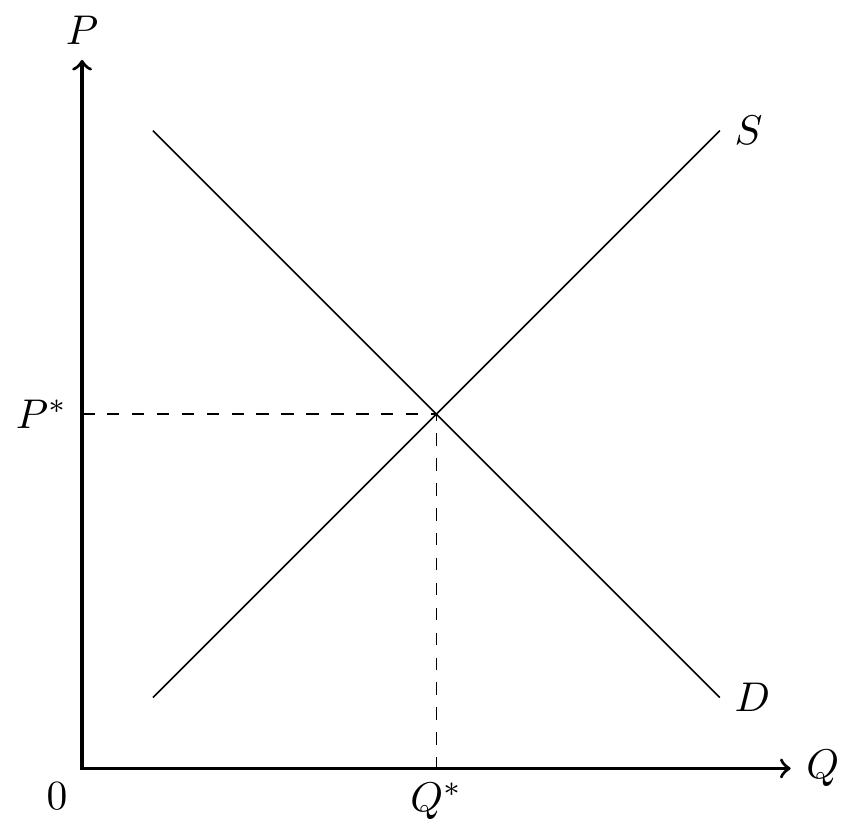
How to generate this graphic? By the following code:
\begin{tikzpicture}[scale=0.6]
\draw [thick,<->] (0,10) node[above]{$P$}--(0,0)--(10,0) node[right]{$Q$};
\node [below left] at (0,0) {$0$};
\node [below] at (5,0) {$Q^*$};
\node [left] at (0,5) {$P^*$};
\draw (1,1)--(9,9) node[right]{$S$};
\draw (1,9)--(9,1) node[right]{$D$};
\draw[dashed] (0,5)--(5,5)--(5,0);
\end{tikzpicture}
Loading tikZ Package
To load the TikZ package, we just need to use the function \usepackage{tikz}
\documentclass{article}
\usepacakage{tikz}
\begin{document}
Hello World!
\end{document}
Then start the drawing environment that begins with \begin{tikzpicture} and ends with \end{tikzpicture}.
\documentclass{article}
\usepacakage{tikz}
\begin{document}
\begin{tikzpicture}
...TikZ codes to put here...
\end{tikzpicture}
\end{document}
To draw a straight line, use \draw, and specify the coordinates. Remember ending the each line of code by semicolon.
\documentclass{article}
\usepacakage{tikz}
\begin{document}
\begin{tikzpicture}
  \draw(0,0)--(6,6);
\end{tikzpicture}
\end{document}
To add description, we use \node and specifiy the coodinates after at.
\documentclass{article}
\usepacakage{tikz}
\begin{document}
\begin{tikzpicture}
  \draw(0,0)--(6,6);
  \node at (2,5) {Hello, this is $\alpha$};
\end{tikzpicture}
\end{document}
Then we can draw the demand and supply diagram above:
\documentclass{article}
\usepacakage{tikz}
\begin{document}
\begin{tikzpicture}
  \draw [thick,<->] (0,10) --(0,0)--(10,0);
  \node [above] at (0,10) {$P$};
  \node [right] at (10,0) {$Q$};
  \node [below left] at (0,0) {$0$};
  \draw (1,1)--(9,9);
  \node [right] at (9,9) {$S$}
  \draw (1,9)--(9,1);
  \node [right] at (9,9) {$D$};
  \draw [dashed] (0,5)--(5,5)--(5,0);
  \node [below] at (5,0) {$Q^*$};
  \node [left] at (0,5) {$P^*$};
\end{tikzpicture}
\end{document}
Above we have used some decoration of the lines.
- Line pattern: For dashed line, use
\draw[dashed]. - Arrows: For arrows at the tips, use
\draw[<->]. - Thickness: For thicker line, use
\draw[thick].
To shift the location of the nodes, we use \node[location] where location can be below/left/right/above/below left.